Best practices for estimating and reporting epidemiological delay distributions of infectious diseases using public health surveillance and healthcare data
What did we do?
Epidemiological delay distributions tend to come up during nearly every infectious disease outbreak because they inform public health policy and clinical practice. We recently posted a preprint about best practices for estimating and reporting epidemiological delay distributions of infectious diseases. Echoing Sam, this is the paper I wish I had read prior to the 2022 mpox outbreak when I was a Prevention Effectiveness Fellow at the CDC Poxvirus and Rabies Branch.
Why did we do it?
The manuscript was inspired by another preprint led by Sang Woo Park. That preprint mainly focused on the biases that can affect delays and methods for adjustment. Originally, we wanted to increase the accessibility of that work by summarizing it. Our target audience would be people with data, such as those who work for public health agencies. We aimed to have no mathematical equations and to try to limit ourselves to 4,000 words. While writing the paper, we realized that there was no good summary of all the things to consider when estimating or using delay distributions. Because of this gap, we decided to broaden the scope of the paper to include other aspects that should be considered when estimating delays. The approach we took was heavily inspired by Gostic et al.’s paper on Rt and Lipsitch et al.’s paper on case fatality risks. The result was a set of guidelines for anyone generating or assessing estimates of delays.
Key takeaways
- A number of items are necessary for understanding the context of delay estimates and should be reported whenever possible to maximize utility, such as study sample size; the epidemic curve; which, if any, control measures are in place, etc.
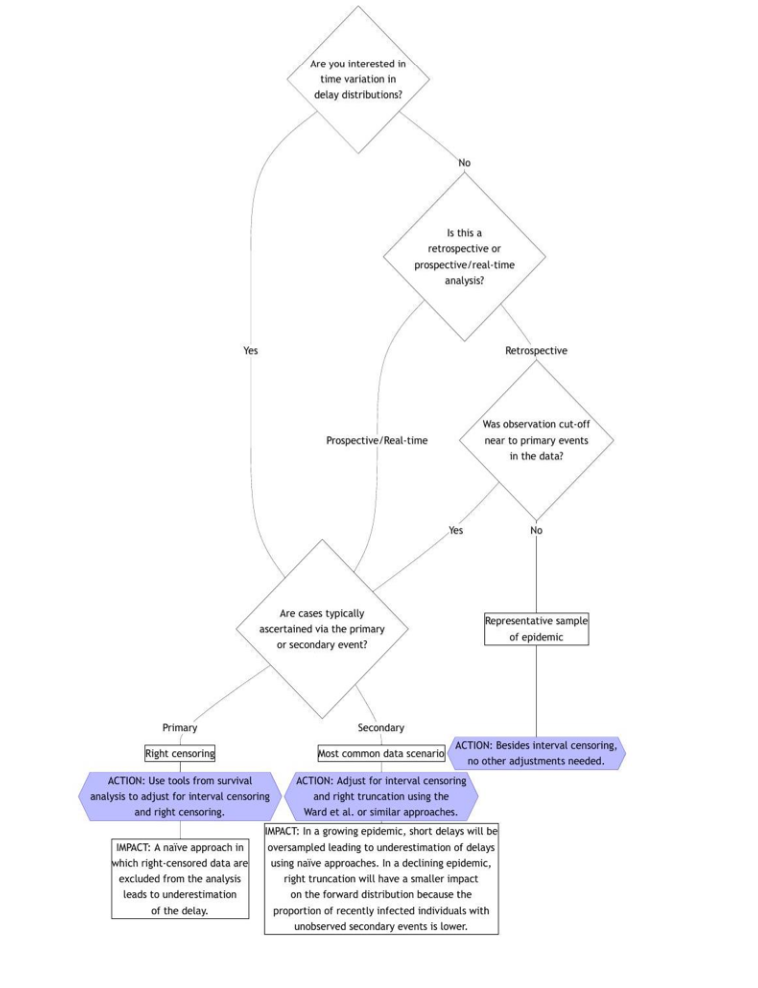
- Not adjusting for routinely present bias (such as interval censoring and right truncation) can lead to incorrect estimates of delays, which can have direct implications for public health practice. See below and the preprint for a handy flow chart!
- The epidist R package is the only software tool to our knowledge that correctly handles interval censoring, right truncation, and dynamical bias
- There is more work to do in improving methods that can robustly handle common biases and making these widely available.
Finding out more
- Our preprint is available on arXiv
- We recommend reading Park et al. for more technical details about methods.
- There is also a summary post for Park et al. available here.
Thanks to all our co-authors for sharing their time and wealth of experience to improve the paper.