Estimating epidemiological delay distributions for infectious diseases

This blog post is based on a preprint we recently posted with a large authorship group. Here we summarise our main takeaways from the project. Sam has also written a blog post of his motivation for this paper.
Epidemiological delay distributions are important
Epidemiological delay distributions provide key information for influencing epidemic situational awareness, control strategies, and resource allocation. Examples of delay distributions include the incubation period, serial interval, and reporting delays. The incubation period is the time between infection and symptom onset, the serial interval is the time between symptom onset in a primary case and symptom onset in a secondary case, and the reporting delay is the time between symptom onset (or other primary indicator) and reporting of a case. These distributions are critical for understanding the dynamics of an epidemic. They can also be used to help estimate the effectiveness of control measures, for example by helping to account for the time between implementation of a control measure and any related observed reduction in transmission.
Estimating delay distributions is challenging
Estimating delay distributions is challenging because of the presence of various sources of biases and the lack of widespread adoption (mainly due to the lack of availability and knowledge) of robust methods for accounting for these biases. The main sources of bias to consider in commonly available data are:
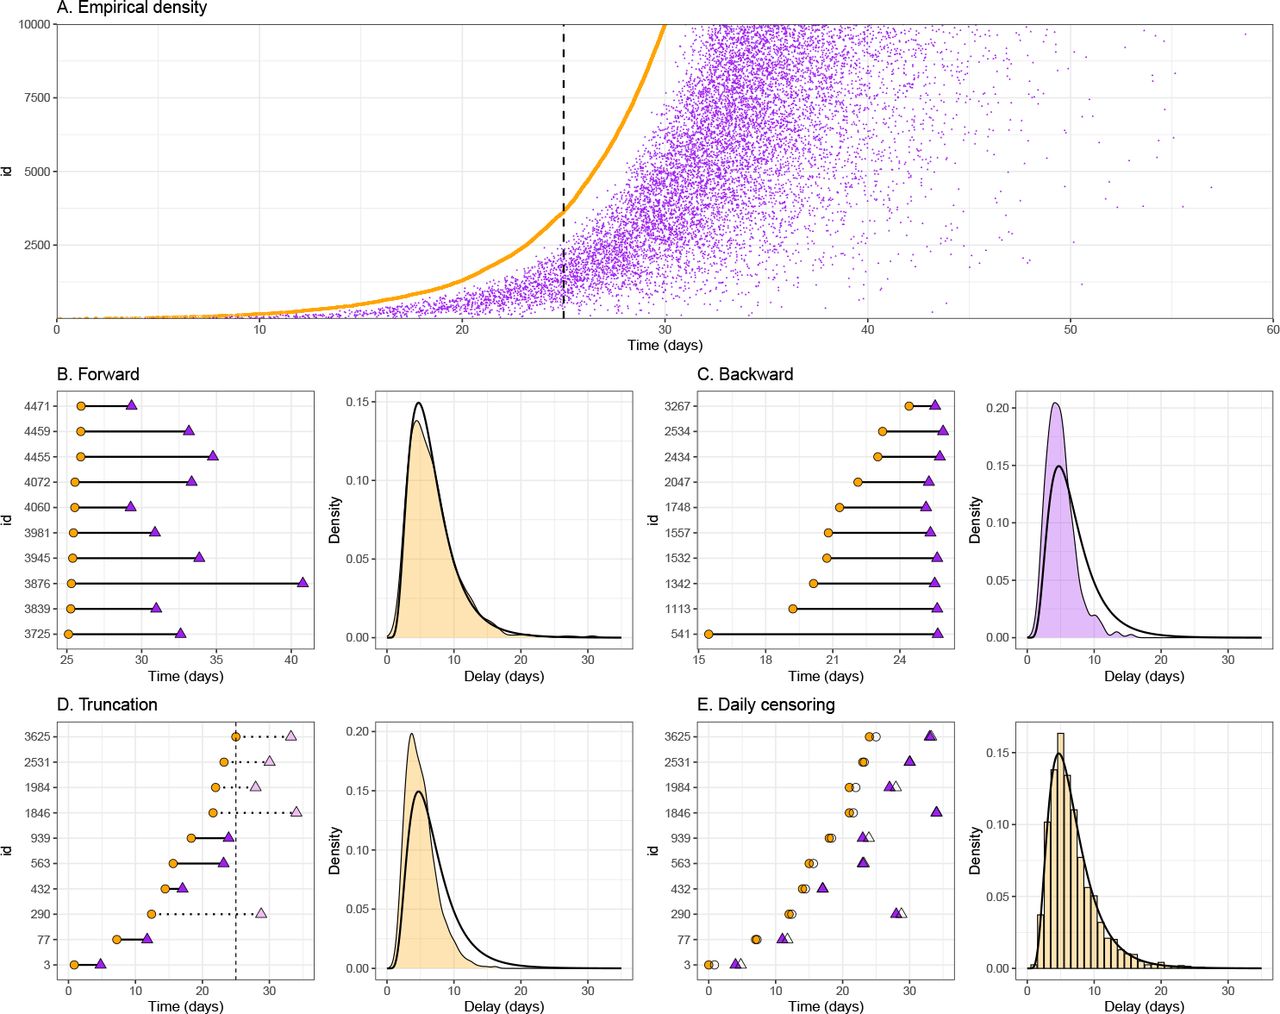
Right truncation: Right truncation describes the incomplete observation of delays, for which the primary event already occurred but the secondary event has not been observed (e.g. infections that have not yet become symptomatic and therefore not been observed). Right truncation generally leads to underestimation of the mean if not properly accounted for.
Interval censoring: Interval censoring arises when epidemiological events occurring in continuous time are binned into time intervals (e.g., days or weeks). Double censoring of both primary and secondary events is common and is often neglected, leading to biased estimates.
Dynamical bias: Dynamical biases describe the effects of an epidemic’s current growth or decay rate on the observed delay distributions. When epidemic is growing (decaying), we are more likely to observe shorter (longer) intervals, giving biased estimates.
So what did we do?
In this study, we give an overview of the biases in estimating these distributions and consider various methods, both commonly used in the literature and novel, that address these challenges. We evaluate the performance of each method against both simulations and real-world data. Our study also lays out the theoretical foundation for estimating epidemiological distributions, practical guidance on making statistical inferences, and provides a set of tools to implement this guidance.
What did we find?
Many methods exist but are either not widely used or have limitations
We found a wide range of methods in the literature to account for these biases but the majority of these were ad-hoc and unable to fully account for all sources of biases or introduced biases of their own. We also found that many of these methods were not widely used in practice, likely due to the lack of availability of software implementations and the lack of knowledge of these methods.
In general, accounting for right truncation (and interval censoring) is sufficient
A key confusion in the literature was the interaction between dynamic bias and right truncation. In this work, we show that when an epidemic is growing and the aim is to estimate the forward distibution then dynamical bias and right truncation are effectively equivalent and only one of these biases needs to be accounted for. In general, we found that it was often most practical to account for right truncation as this does not require knowledge of the current trajector of the epidemic.
Interval censoring is often neglected or mishandled
We found that interval censoring was often neglected or mishandled in the literature. We found that this was often due to a lack of understanding of the difference between single interval censoring and double interval censoring. We also found that many methods that attempted to account for interval censoring did so incorrectly, leading to biased estimates. However, we found that simple approximations, such as assuming a uniform interval of the sum of the primary and secondary events provided an adequate approximation in many cases. We also found that using a latent variable approach, where both the primary and secondary events are modelled as latent variables, provided a robust approach and improved performance. This approacch was also relatively easy to implement.
So which method should I use?
We identified the method of Ward et al. to be the best performing method. However, this method relies on implicit approximations, which may not hold for more complicated scenarios.
We also introduced and tested two new methods that utilize both incidence time series and delay data. They demonstrated good performance under certain conditions, but they also had inherent limitations depending on the setting.
We find that all methods that we considered had residual biases even when we tried to account for all sources of biases. This is because of a simplifying assumption that the event time is uniformly distributed within the censoring interval. While this is a common assumption, we show that this is generally not true and provide a theoretical framework for dealing with this issue.
What are the key takeaways?
Right truncation and interval censoring are the most important biases to account for in the settings we explored.
The method of Ward et al. (2020) is the best performing method we considered. However, this method relies on implicit approximations, which may not hold for more complicated scenarios.
We also introduced and tested two new methods that utilize both incidence time series and delay data. They demonstrated good performance under certain conditions, but they also had inherent limitations depending on the setting.
All of the methods we considered had residual bias due to assuming a uniform censoring interval for the primary event. While this is a common assumption, we show that this is generally not true and provide a theoretical framework for dealing with this issue.
Delay distribution estimation methods are intrinsically connected to methods of nowcasting count data.
What are the limitations and future directions?
All methods we considered here rely on simplifying assumptions. While we lay out mathematical theory for the exact method that does not rely on simplifying assumptions, we did not implement or test this method yet.
We currently lack a statistically sound method that is able to account for temporal changes in continuous-time epidemiological distributions while adjusting for other sources of biases. Specifically, accounting for changes in the forward distribution requires a cohort-based approach based on primary event time. However, the presence of interval censoring in primary event time adds challenges to assigning each individual into cohorts because uncertainty in primary event time need to be taken into account.
There are many other sources of biases that may occur during the data collection or cleaning processes which we did not consider in this study.
We primarily focused on estimating single-individual delays, such as the incubation period or reporting delay. There are additional challenges to estimating transmission intervals that involve more than one person, such as uncertainties in who infected whom. While the methods we considered in this paper can be used to estimate transmission interval distributions, additional attention is needed to consider other sources of biases.
For more details, please see our preprint.